A Higher Form of Asset Intelligence.

PROVIDER:

AsInt, Inc.

Digital Wall Chart

An interactive and visual representation of critical data and KPIs to help you monitor, discover, and follow process of an outage or shutdown.

Product Features

Know more about our product details.

Real-Time Data Visualization
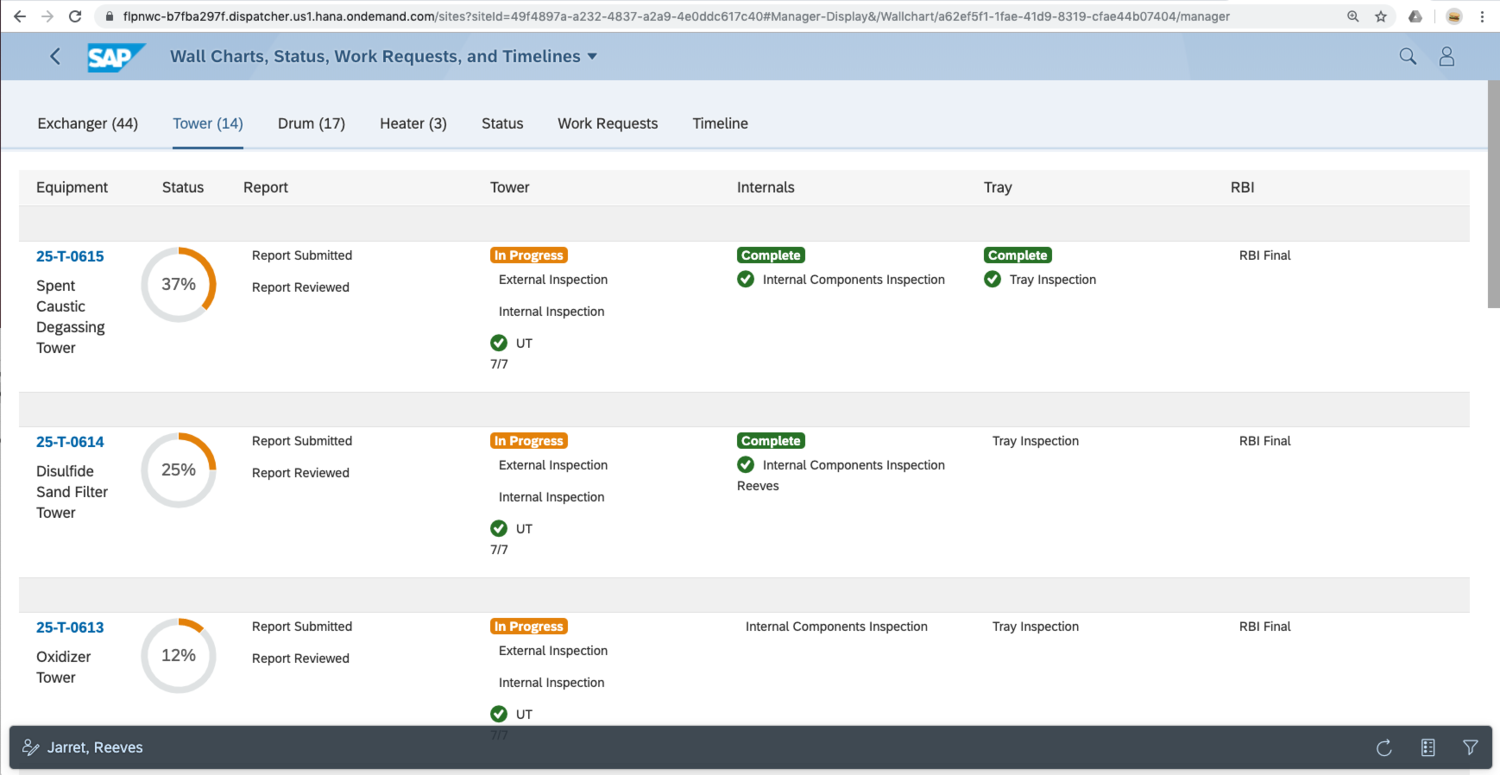
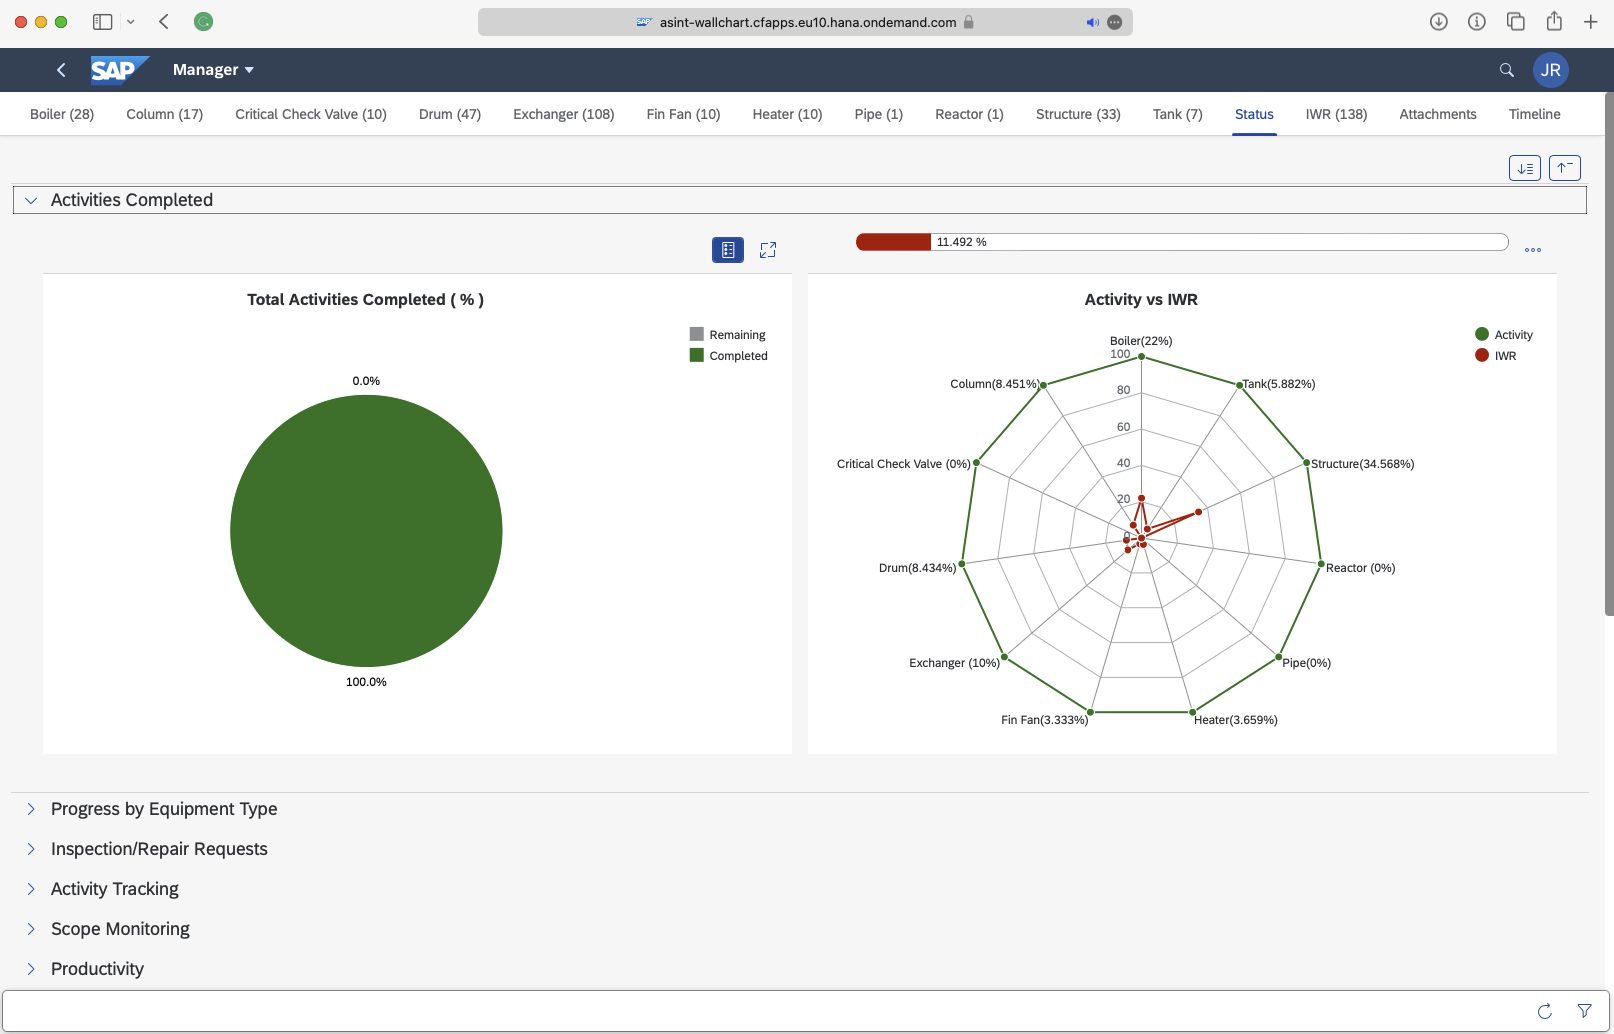
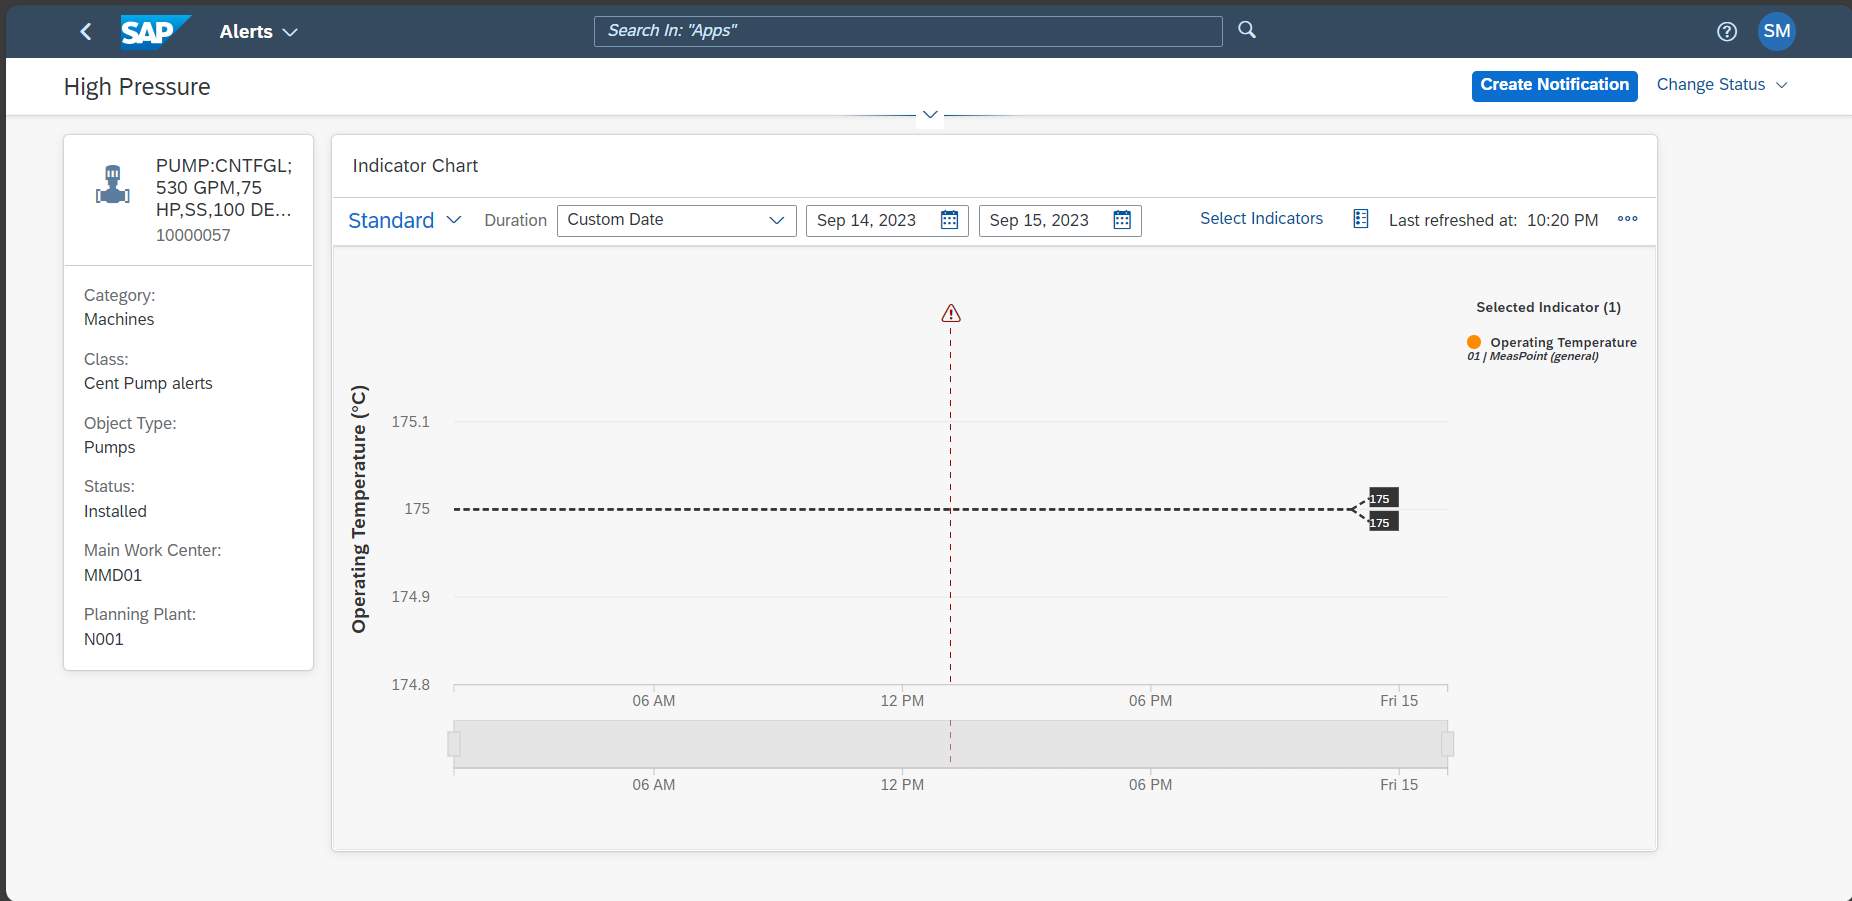
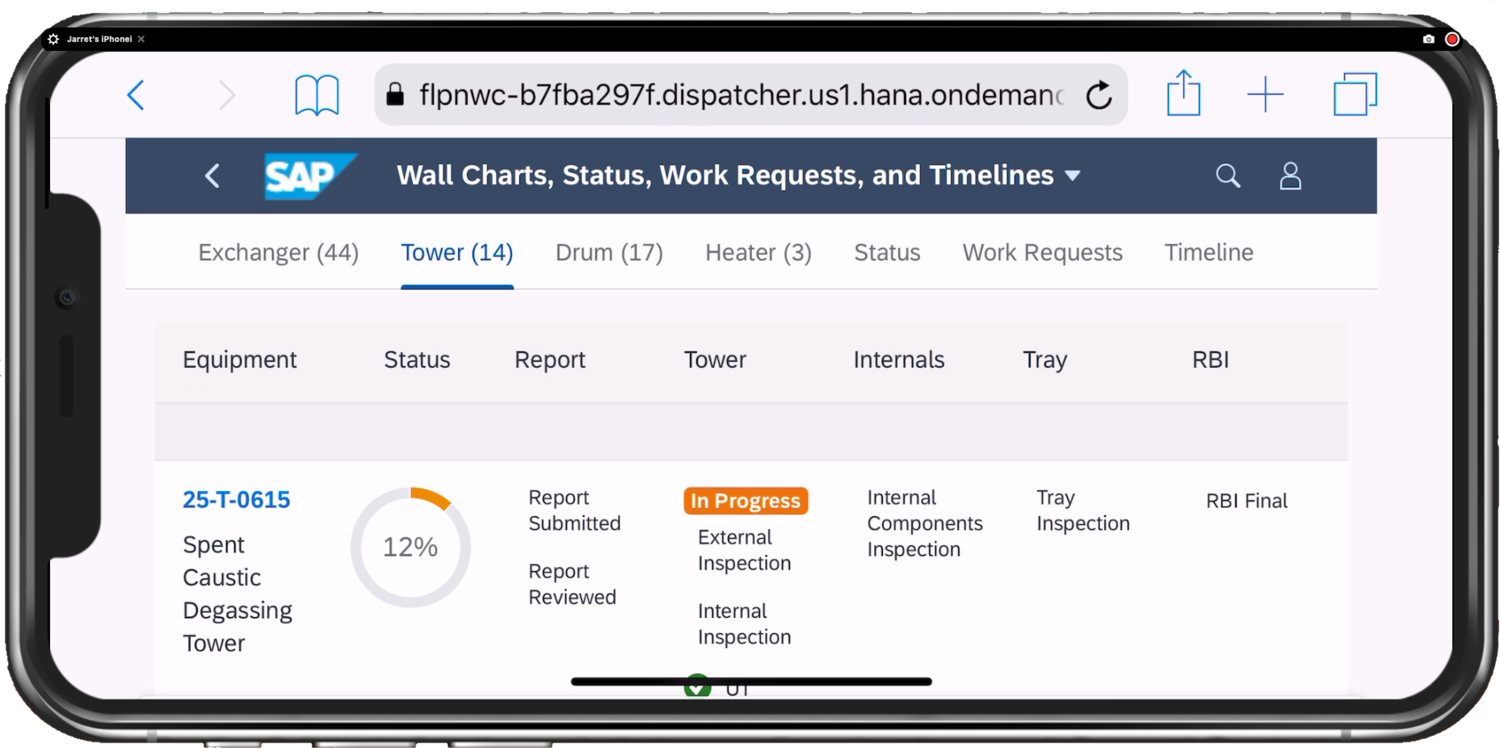
Visualize information from sensors, devices, and systems all around a facility to keep an eye on various events happening in real-time, make quick decisions, and keep things running smoothly. This data can include parameters like temperature, pressure, flow rates, equipment status, and production metrics.
Dynamic Wall Chart
Wallchart KPis 2
Interactive Dashboards
With interactive elements such as touchscreens or interactive dashboards, you can access data specific to a particular entity, drill down for more information, and make informed decisions.
Performance Monitoring
Closely monitor how essential equipment, processes, and systems perform within a facility with real-time data and comprehensive visualization. Track your progress toward production targets, and check if critical equipment is operating as expected.
image (14)
Mobile+View.jpeg
Accessible Via Many Platforms, Including Mobile
Available to view the information on mobile, desktop, tablets, or touch screens. Can be accessessed from anywhere an internet connection is available.

Talk to an Expert

Need Help?

Confused about selecting a product or need to know more about product. Talk to our experts.

We will get in touch as early as possible after your submit your query. Please make the message short, specific and sweet